
What it looks like on the ground
Run-to-failure
Problems are found at the breakdown, when repairs are urgent, expensive and disruptive.
Maintenance by the calendar
Equipment is serviced because a date has arrived, not because it needs it: too early on some assets, too late on others.
Capital by opinion
Repair-or-replace decisions are argued from experience rather than data, so budgets go to the loudest request, not the highest risk.
From early signal to result
From fixing breakdowns to planning interventions, and from arguing repair-or-replace to knowing exactly when replacing beats maintaining.
An RO train’s recovery slips from 75% to 71% over three weeks. Nobody notices in the monthly report. With digital, the drift is flagged in the first week, the likely cause (membrane fouling) is identified, a cleaning is scheduled in the next planned window and a work order goes straight to the maintenance team. The train never reaches the point where output or permeate quality suffers.
- WEEK 1
Drift spotted
Recovery starts slipping from 75%, flagged in the first week, not the monthly report.
- DIAGNOSE
Cause explained
Likely cause identified: membrane fouling.
- PLAN
Cleaning scheduled
CIP booked in the next planned window.
- ACT
Work order issued
Maintenance acts before output or permeate quality suffers.
Illustrative scenario. Figures are examples, not customer results.
See it. Understand it. Improve it.
- STEP 01
See it
Every critical asset: pumps, membranes, heat exchangers, cooling systems, boilers, in one live view, with its history and context.
- STEP 02
Understand it
A health score for each asset, early warning of wear, fouling and drift, and the likely cause explained.
- STEP 03
Improve it
Maintenance triggered by condition, planned work orders, and opex-vs-capex guidance that shows when replacing an asset, a membrane set, a pump, costs less than keeping it running.
Keep the plant a positive asset for longer
Every plant loses value as it ages. Once its output drops below the minimum asset production cost band, it costs more to run than it earns. Early warning, condition-based care and timely replacement lift performance back above that line, so the same plant keeps paying its way for years longer.
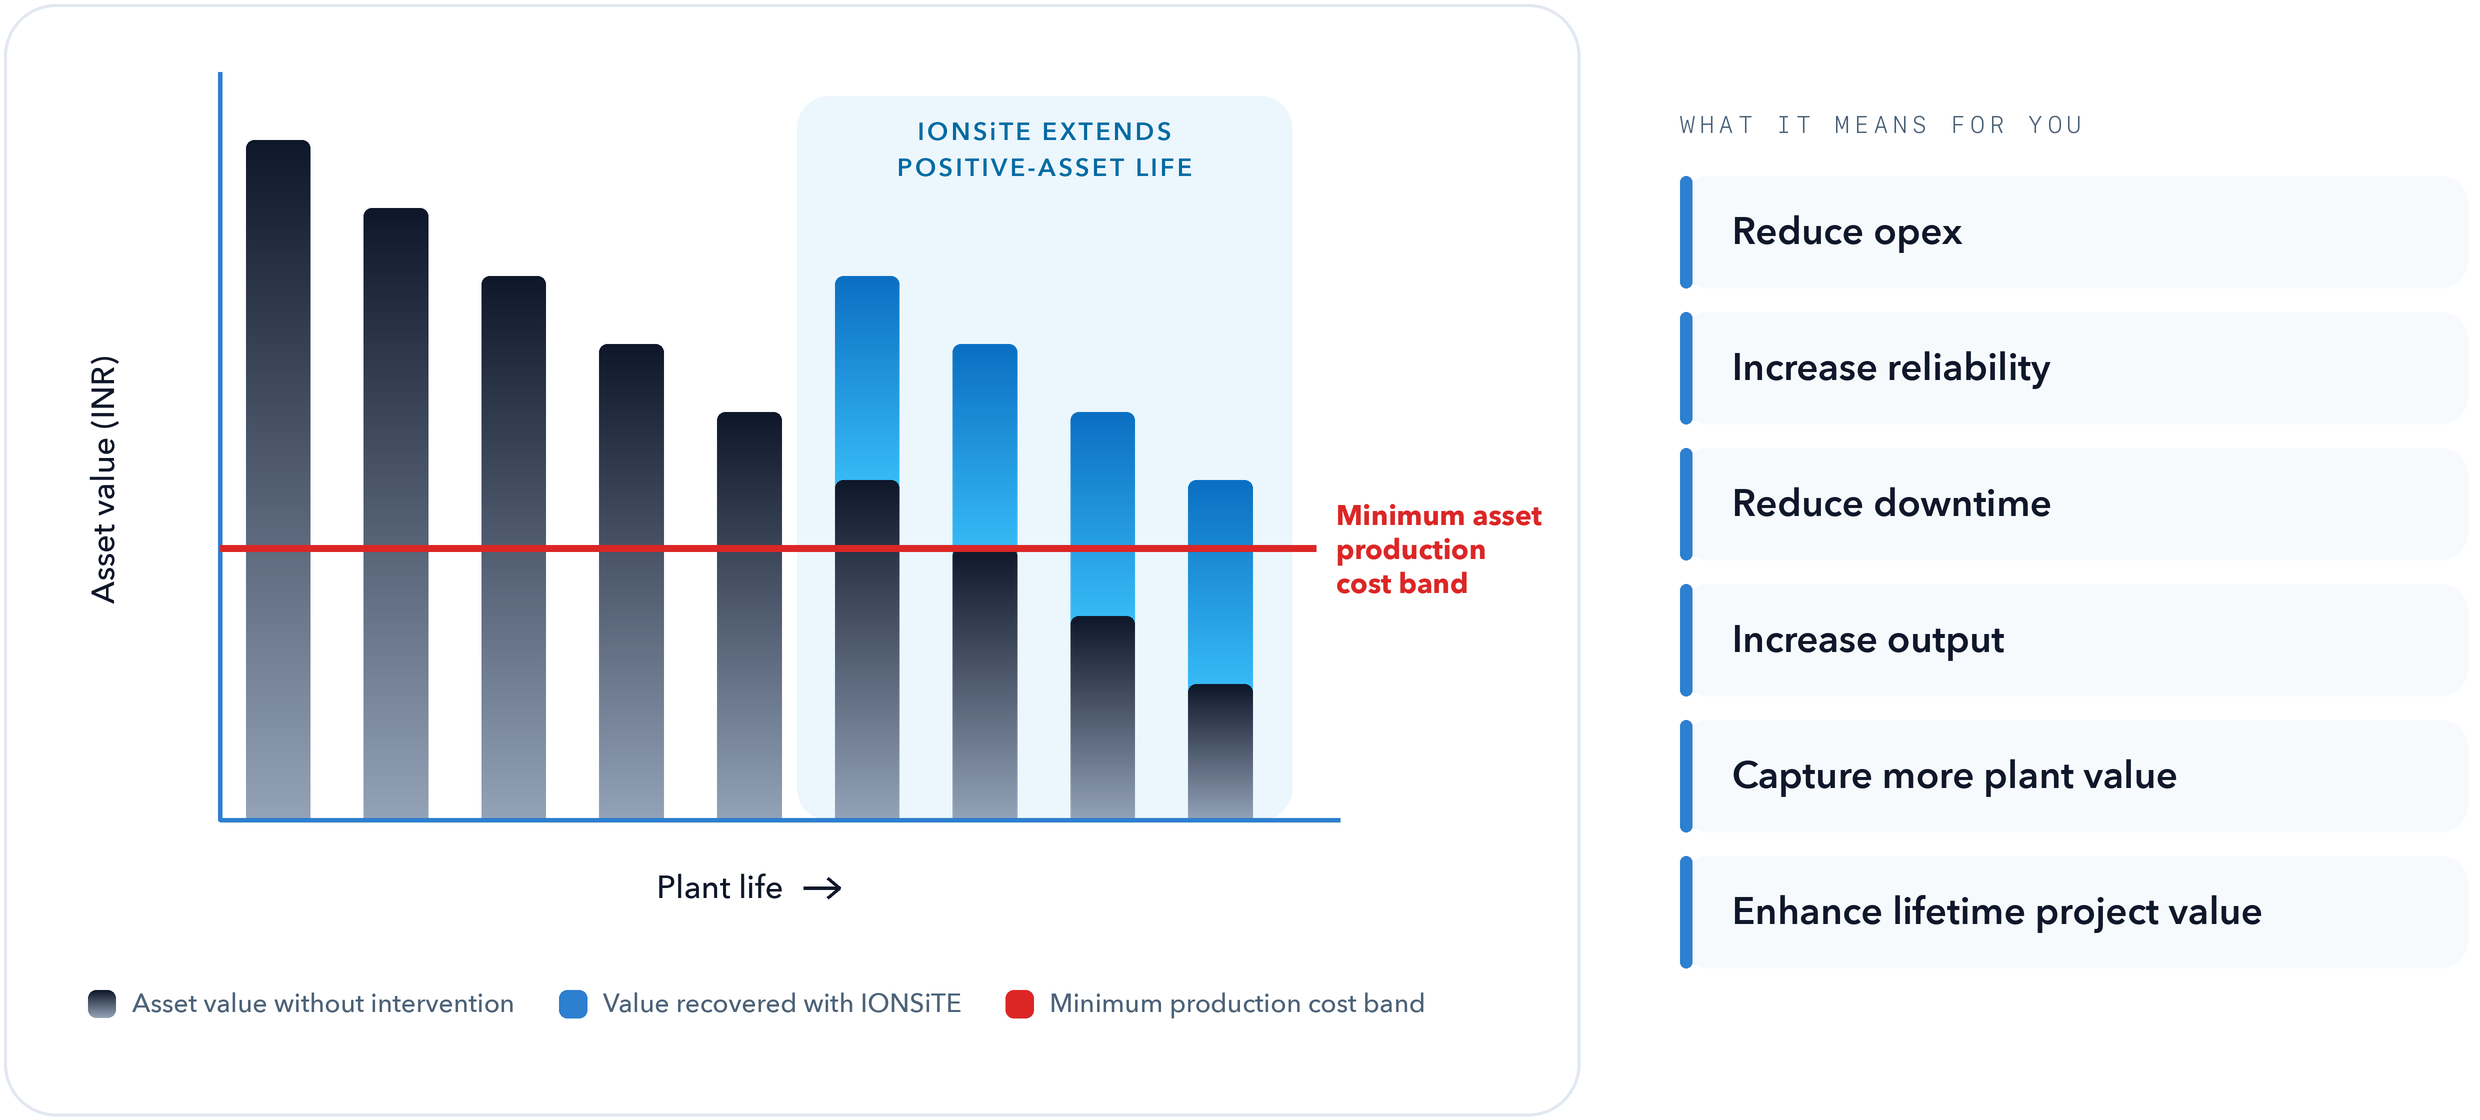
Conceptual illustration, not to scale.
Maintain or replace? Let the numbers decide.
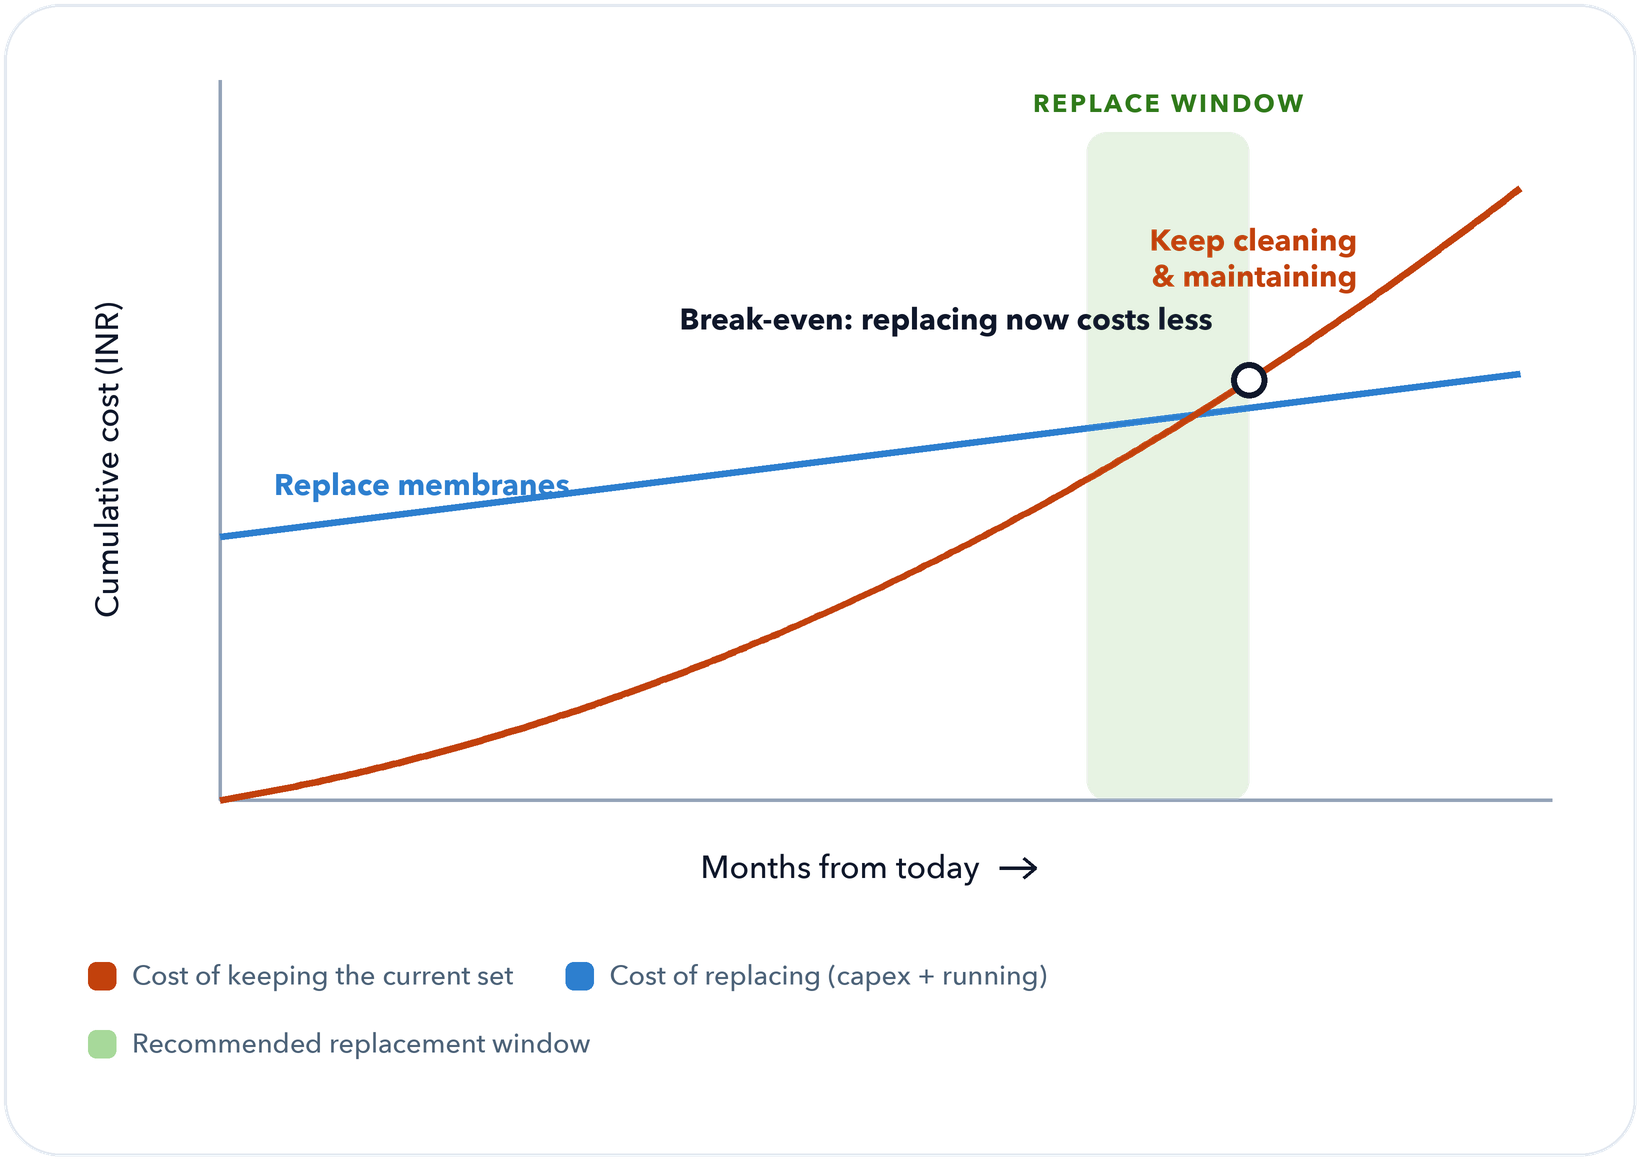
There comes a point where cleaning a membrane again costs more than replacing it. Most plants find that point late, after months of extra chemicals, energy and lost output. We work it out for you, asset by asset, and tell you when it is coming.
COST OF KEEPING IT (OPEX)
- Cleaning frequency CIP intervals shrinking, with more chemicals and downtime per clean.
- Energy per m³ Feed pressure creeping up to hold the same permeate flow.
- Lost output & quality Lower recovery, rising salt passage and production at risk.
- Labour & downtime Crew hours and off-line time for every intervention.
COST OF REPLACING IT (CAPEX)
- Replacement cost New elements, installation and commissioning.
- Restored performance Recovery, energy and quality back near design.
- Remaining life How long the current set can still run before it fails.
- TRACK
Cost of keeping
Cleaning, chemicals, energy and lost output for each membrane set, every day.
- FORECAST
Degradation ahead
Health models project fouling, recovery and remaining useful life.
- COMPARE
Opex vs capex
Running cost of keeping against replacement cost and restored performance.
- DECIDE
Replace on time
A recommended window, planned into the next shutdown and budget cycle.
Illustrative curve. The same logic applies to pumps, heat-exchanger bundles, resins and other wear assets.
What changes for you
Fewer unplanned stops
Problems are caught while they are small and cheap to fix.
Longer asset life
Assets are maintained to their condition, not to the calendar.
Right-timed replacement
Replace when the numbers say so: not too early, not after the losses have piled up.
WHO IT IS FOR
Maintenance and reliability managers, plant heads and asset owners in process industries, utilities, oil & gas and infrastructure.
Other digital solutions
- SOLUTION 02
Water security & environmental compliance
Know where every litre goes, and stay ahead of every limit.
Explore - SOLUTION 03
Process expertise & operational consistency
Run every shift like your best operator is on duty.
Explore - SOLUTION 04
Connected operations: doing more with less
One small team, many sites, one live view.
Explore
Start with a site assessment
Book a site assessment with our water and digital experts. We will review your data and set a baseline, so the improvement can be measured.